https://www.carlballenger.com/2021/08/04/gke-series-in-the-lab-understanding-and-combining-gke-autoscaling-strategies/
Try the related GKE (Google Kubernetes Engine) steps and concepts on your own with a FREE Google Cloud Platform free tier signup getting you 90 days on a $300 Free Trial credit using any Google Cloud Platform Service available.
https://cloud.google.com/free/docs/gcp-free-tier#free-trial

Understanding and Combining GKE Autoscaling Strategies
Overview
Google Kubernetes Engine has horizontal and vertical solutions for automatically scaling your pods as well as your infrastructure. When it comes to cost-optimization, these tools become extremely useful in ensuring that your workloads are being run as efficiently as possible and that you’re only paying for what you’re using.
In this lab you will set up and observe Horizontal Pod Autoscaling and Vertical Pod Autoscaling for pod-level scaling and Cluster Autoscaler (horizontal infrastructure solution) and Node Auto Provisioning (vertical infrastructure solution) for node-level scaling. First you’ll use these autoscaling tools to save as many resources as possible and shrink your cluster’s size during a period of low demand. Then you will increase the demands of your cluster and observe how autoscaling maintains availability.
What You’ll Do
- Decrease number of replicas for a Deployment with Horizontal Pod Autoscaler
- Decrease CPU request of a Deployment with Vertical Pod Autoscaler
- Decrease number of nodes used in cluster with Cluster Autoscaler
- Automatically create an optimized node pool for workload with Node Auto Provisioning
- Test the autoscaling behavior against a spike in demand
- Overprovision your cluster with Pause Pods
Provision testing environment
Set your default zone to us-central1-a:
gcloud config set compute/zone us-central1-aRun the following command to create a three node cluster in the us-central1-a zone:
gcloud container clusters create scaling-demo --num-nodes=3 --enable-vertical-pod-autoscalingTo help demonstrate horizontal pod autoscaling, this lab uses a custom docker image based on the php-apache image. It defines an index.php page which performs some CPU intensive computations. You will monitor a deployment of this image.
Create a manifest for the php-apache deployment:
cat << EOF > php-apache.yaml
apiVersion: apps/v1
kind: Deployment
metadata:
  name: php-apache
spec:
  selector:
    matchLabels:
      run: php-apache
  replicas: 3
  template:
    metadata:
      labels:
        run: php-apache
    spec:
      containers:
      - name: php-apache
        image: k8s.gcr.io/hpa-example
        ports:
        - containerPort: 80
        resources:
          limits:
            cpu: 500m
          requests:
            cpu: 200m
---
apiVersion: v1
kind: Service
metadata:
  name: php-apache
  labels:
    run: php-apache
spec:
  ports:
  - port: 80
  selector:
    run: php-apache
EOF
Apply the newly created manifest to your cluster:
kubectl apply -f php-apache.yamlProvision testing environment
Scale pods with Horizontal Pod Autoscaling
Horizontal Pod Autoscaling changes the shape of your Kubernetes workload by automatically increasing or decreasing the number of pods in response to the workload’s CPU or memory consumption, or in response to custom metrics reported from within Kubernetes or external metrics from sources outside of your cluster.
In Cloud Shell, run this command to inspect your cluster’s deployments:
kubectl get deploymentYou should see the php-apache deployment with 3/3 pods running:

Apply horizontal autoscaling to the php-apache deployment:
kubectl autoscale deployment php-apache --cpu-percent=50 --min=1 --max=10Scale pods with Horizontal Pod Autoscaling
This autoscale command will configure a Horizontal Pod Autoscaler that will maintain between 1 and 10 replicas of the pods controlled by the php-apache deployment. The cpu-percent flag specifies 50% as the target average CPU utilization of requested CPU over all the pods. HPA will adjust the number of replicas (via the deployment) to maintain an average CPU utilization of 50% across all pods.
Check the current status of your Horizontal Pod Autoscaler:
kubectl get hpaUnder the Targets column you should see 0%/50%.
This means that the pods within your deployment are currently at 0% of their target average CPU utilization. This is to be expected as the php-apache app is receiving no traffic right now.
Also, take note of the Replicas column. To start with, the value will be 3. This number will be changed by the autoscaler as the number of required pods changes.
In this case, the autoscaler will scale the deployment down to the minimum number of pods indicated when you run the autoscale command. Horizontal Pod Autoscaling takes 5-10 minutes and will require shutting down or starting new pods depending on which way it’s scaling.
Continue to the next step of the lab. You will inspect the results of the autoscaler later on.
Scale size of pods with Vertical Pod Autoscaling
Vertical Pod Autoscaling frees you from having to think about what values to specify for a container’s CPU and memory requests. The autoscaler can recommend values for CPU and memory requests and limits, or it can automatically update the values.
Vertical Pod Autoscaling has already been enabled on the scaling-demo cluster. To verify run:
gcloud container clusters describe scaling-demo | grep ^verticalPodAutoscaling -A 1The output should read enabled: true
To demonstrate VPA, you will deploy the hello-server app.
Apply the hello-server deployment to your cluster:
kubectl create deployment hello-server --image=gcr.io/google-samples/hello-app:1.0Ensure the deployment was successfully created:
kubectl get deployment hello-serverAssign a CPU resource request of 450m to the deployment:
kubectl set resources deployment hello-server --requests=cpu=450mNext, run this command to inspect the container specifics of the hello-server pods:
kubectl describe pod hello-server | sed -n "/Containers:$/,/Conditions:/p"In the output, find Requests. Note that this pod is currently requesting the 450m CPU you assigned.
Now, create a manifest for you Vertical Pod Autoscaler:
cat << EOF > hello-vpa.yaml
apiVersion: autoscaling.k8s.io/v1
kind: VerticalPodAutoscaler
metadata:
  name: hello-server-vpa
spec:
  targetRef:
    apiVersion: "apps/v1"
    kind:       Deployment
    name:       hello-server
  updatePolicy:
    updateMode: "Off"
EOF
The above generates a manifest for a Vertical Pod Autoscaler targeting the hello-server deployment with an Update Policy of Off. A VPA can have one of three different update policies which can be useful depending on your application:
- Off: this policy means VPA will generate recommendations based on historical data which you can manually apply.
- Initial: VPA recommendations will be used to create new pods once and then won’t change the pod size after.
- Auto: pods will regularly be deleted and recreated to match the size of the recommendations.
Apply the manifest for hello-vpa:
kubectl apply -f hello-vpa.yamlWait a minute, and then view the VerticalPodAutoscaler:
kubectl describe vpa hello-server-vpaLocate the “Container Recommendations” at the end of the output. If you don’t see it, wait a little longer and try the previous command again. When it appears, you’ll see several different recommendation types, each with values for CPU and memory:
- Lower Bound: this is the lower bound number VPA looks at for triggering a resize. If your pod utilization goes below this, VPA will delete the pod and scale it down.
- Target: this is the value VPA will use when resizing the pod.
- Uncapped Target: if no minimum or maximum capacity is assigned to the VPA, this will be the target utilization for VPA.
- Upper Bound: this is the upper bound number VPA looks at for triggering a resize. If your pod utilization goes above this, VPA will delete the pod and scale it up.
You’ll notice VPA is recommending the CPU request for this container be set to 25m instead of the previous 100m as well as giving you a suggested number for how much memory should be requested. At this point, these recommendations can be manually applied to the hello-server deployment.
In order to observe VPA and its effects within this lab, you will change the hello-vpa update policy to Auto and observe the scaling.
Update the manifest to set the policy to Auto and apply the configuration:
sed -i 's/Off/Auto/g' hello-vpa.yaml
kubectl apply -f hello-vpa.yaml
In order to resize a pod, Vertical Pod Autoscaler will need to delete that pod and recreate it with the new size. By default, to avoid downtime, VPA will not delete and resize the last active pod. Because of this, you will need at least 2 replicas to see VPA make any changes.
Scale hello-server deployment to 2 replicas:
kubectl scale deployment hello-server --replicas=2Now, watch your pods:
kubectl get pods -wWait until you see your hello-server-xxx pods in the terminating status:

This is a sign that your VPA is deleting and resizing your pods. Once you see this, press Ctrl + c to quit the command.
Scale size of pods with Vertical Pod Autoscaling
HPA results
By this point, your Horizontal Pod Autoscaler will have most likely scaled your php-apache deployment down.
Run this command to check your HPA:
kubectl get hpaLook at the Replicas column. You’ll see that your php-apache deployment has been scaled down to 1 pod.
The HPA takes advantage of the fact that the app is inactive right now and removes all the unused resources. Furthermore, if more demand were placed on the php-apache app, it would scale back up to account for the load.
This is extremely useful when thinking about cost optimization. A well-tuned autoscaler means that you are maintaining high availability of your application while only paying for the resources that are required to maintain that availability, regardless of the demand.
VPA results
Now, the VPA should have resized your pods in the hello-server deployment. Inspect your pods:
kubectl describe pod hello-server | sed -n "/Containers:$/,/Conditions:/p"Find the Requests: field. Your Vertical Pod Autoscaler recreated the pods with their target utilizations. Now it should be requesting a lower amount of CPU and also be requesting a certain amount of memory:

In this case, VPA becomes an excellent tool for optimizing resource utilization and, in effect, saving on costs. The original request of 400m of CPU was higher than what this container needed. By adjusting the request to the recommended 25m, you’re able to use less CPU from the node pool, potentially to the point of requiring less nodes to be provisioned in the cluster.
With the Auto update policy, your VPA would continue to delete and resize the pods of the hello-server deployment throughout its lifetime. It could scale pods up with larger requests to handle heavy traffic and then scale back down during a downtime. This can be great for accounting for steady increases of demand for your application, but it does risk losing availability during heavy spikes.
Depending on your application, it’s generally safest to use VPA with the Off update policy and take the recommendations as needed in order to both optimize resource usage and maximize your cluster’s availability.
In the next sections, you will look at how to further optimize your resource utilization with the Cluster Autoscaler and Node Auto Provisioning.
Cluster autoscaler
The Cluster Autoscaler is designed to add or remove nodes based on demand. When demand is high, cluster autoscaler will add nodes to the node pool to accommodate that demand. When demand is low, cluster autoscaler will scale your cluster back down by removing nodes. This allows you to maintain high availability of your cluster while minimizing superfluous costs associated with additional machines.
Enable autoscaling for your cluster:
gcloud beta container clusters update scaling-demo --enable-autoscaling --min-nodes 1 --max-nodes 5This will take a few minutes to complete.
When scaling a cluster, the decision of when to remove a node is a trade-off between optimizing for utilization or the availability of resources. Removing underutilized nodes improves cluster utilization, but new workloads might have to wait for resources to be provisioned again before they can run.
You can specify which autoscaling profile to use when making such decisions. The currently available profiles are:
- Balanced: The default profile.
- Optimize-utilization: Prioritize optimizing utilization over keeping spare resources in the cluster. When selected, the cluster autoscaler scales down the cluster more aggressively. It can remove more nodes, and remove nodes faster. This profile has been optimized for use with batch workloads that are not sensitive to start-up latency.
Switch to the optimize-utilization autoscaling profile so that the full effects of scaling can be observed:
gcloud beta container clusters update scaling-demo \
--autoscaling-profile optimize-utilization
With autoscaling enabled, observe your cluster in the Cloud Console. Click the three bars at the top left to open the Navigation menu.
From the Navigation menu, select Kubernetes Engine > Clusters.
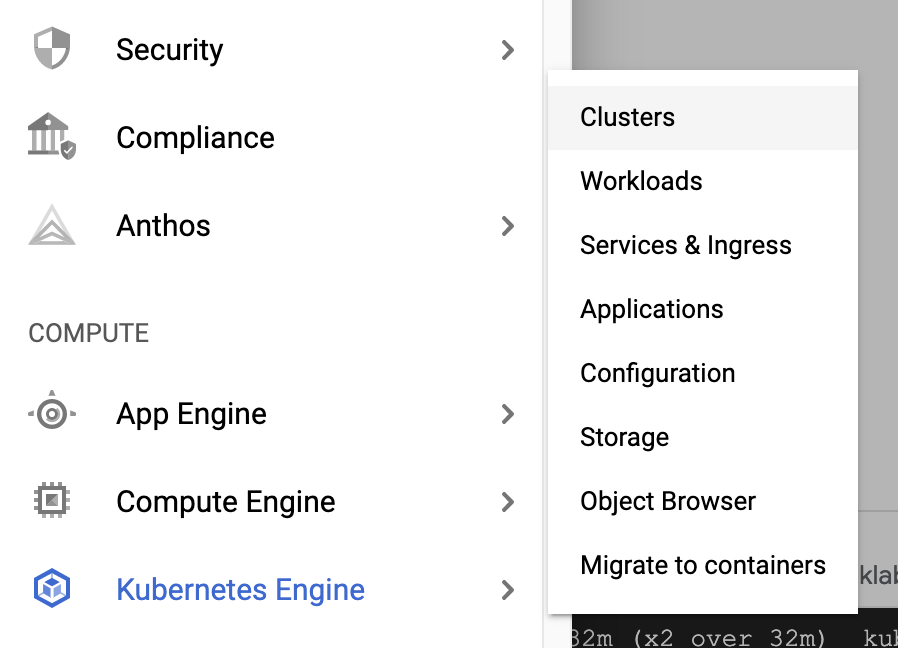
On the Clusters page, select the scaling-demo cluster.
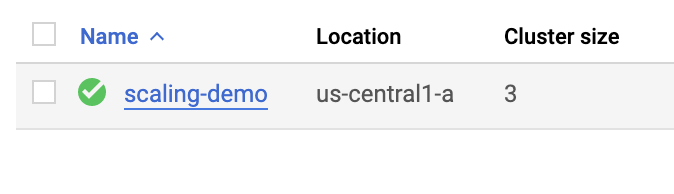
In the scaling-demo’s cluster page, select the Nodes tab:

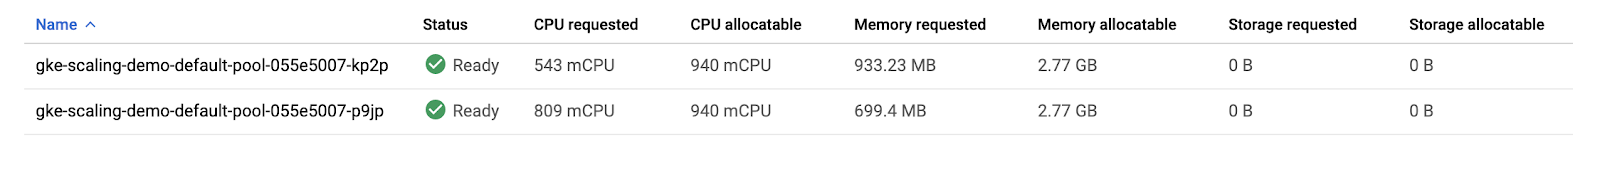
Take a look at the overview of your three nodes’ resource utilization.
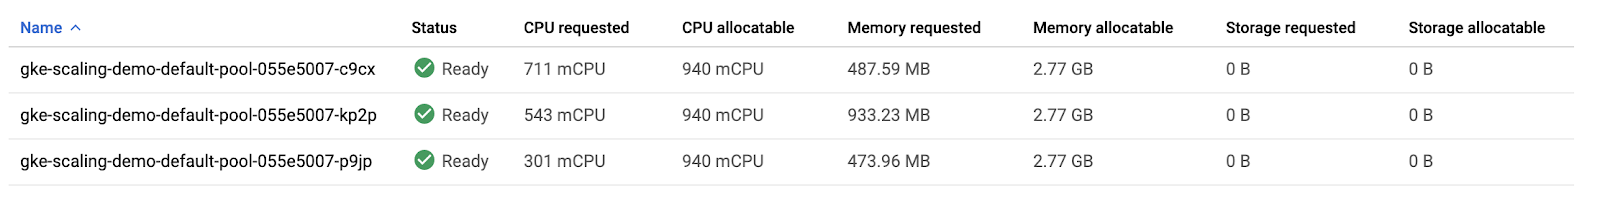
If you combine the values of CPU requested and CPU allocatable for the 3 nodes, the totals would be 1555m and 2820m, respectively. This means that there’s a total of 1265m CPU available across the entire cluster. This is greater than what could be provided by one node.
To optimize utilization, the current workload at its current demand could be consolidated into two nodes instead of three. However, your cluster hasn’t automatically scaled down yet. This is because of the system pods distributed across the cluster.
Your cluster runs a number of deployments under the kube-system namespace which allow the different GKE services like logging, monitoring, autoscaling, etc. to work. This can be verified by running this command in Cloud Shell:
kubectl get deployment -n kube-systemBy default, most of the system pods from these deployments will prevent cluster autoscaler from taking them completely offline to reschedule them. Generally, this is desired because many of these pods collect data used in other deployments and services. For example, metrics-agent being temporarily down would cause a gap in data collected for VPA and HPA, or the fluentd pod being down could create a gap in your cloud logs.
For the purpose of this lab, you will apply Pod Disruption Budgets to your kube-system pods which will allow cluster autoscaler to safely reschedule them on another node. This will give enough room to scale your cluster down.
Pod Disruption Budgets (PDB) define how Kubernetes should handle disruptions like upgrades, pod removals, running out of resources, etc. In PDBs, you can specify the max-unavailable and/or the min-available number of pods a deployment should have.
Run these commands to create the Pod Disruption Budgets for each of your kube-system pods:
kubectl create poddisruptionbudget kube-dns-pdb --namespace=kube-system --selector k8s-app=kube-dns --max-unavailable 1
kubectl create poddisruptionbudget prometheus-pdb --namespace=kube-system --selector k8s-app=prometheus-to-sd --max-unavailable 1
kubectl create poddisruptionbudget kube-proxy-pdb --namespace=kube-system --selector component=kube-proxy --max-unavailable 1
kubectl create poddisruptionbudget metrics-agent-pdb --namespace=kube-system --selector k8s-app=gke-metrics-agent --max-unavailable 1
kubectl create poddisruptionbudget metrics-server-pdb --namespace=kube-system --selector k8s-app=metrics-server --max-unavailable 1
kubectl create poddisruptionbudget fluentd-pdb --namespace=kube-system --selector k8s-app=fluentd-gke --max-unavailable 1
kubectl create poddisruptionbudget backend-pdb --namespace=kube-system --selector k8s-app=glbc --max-unavailable 1
kubectl create poddisruptionbudget kube-dns-autoscaler-pdb --namespace=kube-system --selector k8s-app=kube-dns-autoscaler --max-unavailable 1
kubectl create poddisruptionbudget stackdriver-pdb --namespace=kube-system --selector app=stackdriver-metadata-agent --max-unavailable 1
kubectl create poddisruptionbudget event-pdb --namespace=kube-system --selector k8s-app=event-exporter --max-unavailable 1Cluster autoscaler
In each of these commands, you are selecting a different kube-system deployment pod based off a label defined in its creation and specifying that there can be 1 unavailable pod for each of these deployments. This will allow the autoscaler to reschedule the system pods.
With the PDBs in place, your cluster should scale down from three nodes to two nodes in a minute or two.
Rerun this command in Cloud Shell until you see only two nodes total:
kubectl get nodesIn the Cloud Console, refresh the Nodes tab of your scaling-demo or return there with this link to inspect how your resources were packed:
You set up automation that scaled your cluster down from three nodes to two nodes!
Thinking about the costs, as a result of scaling down your nodepool, you will be billed for less machines during periods of low demand on your cluster. This scaling could be even more dramatic if you were fluctuating from high demand to low demand periods during the day.
It’s important to note that, while Cluster Autoscaler removed an unnecessary node, Vertical Pod Autoscaling and Horizontal Pod Autoscaling helped reduce enough CPU demand so that the node was no longer needed. Combining these tools is a great way to optimize your overall costs and resource usage.
So, the cluster autoscaler helps add and remove nodes in response to pods needing to be scheduled. However, GKE specifically has another feature to scale vertically, called node auto-provisioning.
Node Auto Provisioning
Node Auto Provisioning (NAP) actually adds new node pools that are sized to meet demand. Without node auto provisioning, the cluster autoscaler will only be creating new nodes in the node pools you’ve specified, meaning the new nodes will be the same machine type as the other nodes in that pool. This is perfect for helping optimize resource usage for batch workloads and other apps that don’t need extreme scaling, since creating a node pool that is specifically optimized for your use case might take more time than just adding more nodes to an existing pool.
Enable Node Auto Provisioning:
gcloud container clusters update scaling-demo \
    --enable-autoprovisioning \
    --min-cpu 1 \
    --min-memory 2 \
    --max-cpu 45 \
    --max-memory 160
In the command, you specify a minimum and maximum number for your CPU and memory resources. This is for the entire cluster.
NAP can take a little bit of time and it’s also highly likely it won’t create a new node pool for the scaling-demo cluster at its current state.
In the next sections, you will increase the demand to your cluster and observe the actions of your autoscalers as well as NAP.
Node Auto Provisioning
Test with Larger Demand
So far, you’ve analyzed how HPA, VPA, and cluster autoscaler can help save resources and costs while your application has low demand. Now, you’ll look at how these tools handle availability for increased demand.
Open a new tab in Cloud Shell by pressing the + icon:

In the new tab, run this command to send an infinite loop of queries to the php-apache service:
kubectl run -i --tty load-generator --rm --image=busybox --restart=Never -- /bin/sh -c "while sleep 0.01; do wget -q -O- http://php-apache; done"Return to your original Cloud Shell tab.
Within a minute or so, you should see the higher CPU load on your HPA by executing:
kubectl get hpaWait and rerun the command until you see your target above 100%.

Now, monitor how your cluster handles the increased load by periodically running this command:
kubectl get deployment php-apacheYou can also monitor your cluster by refreshing the nodes tab in your Cloud Console or or returning to it with this link
After a few minutes, you will see a few things happen.
- First, your
php-apachedeployment will automatically be scaled up by HPA to handle the increased load. - Then, cluster autoscaler will need to provision new nodes to handle the increased demand.
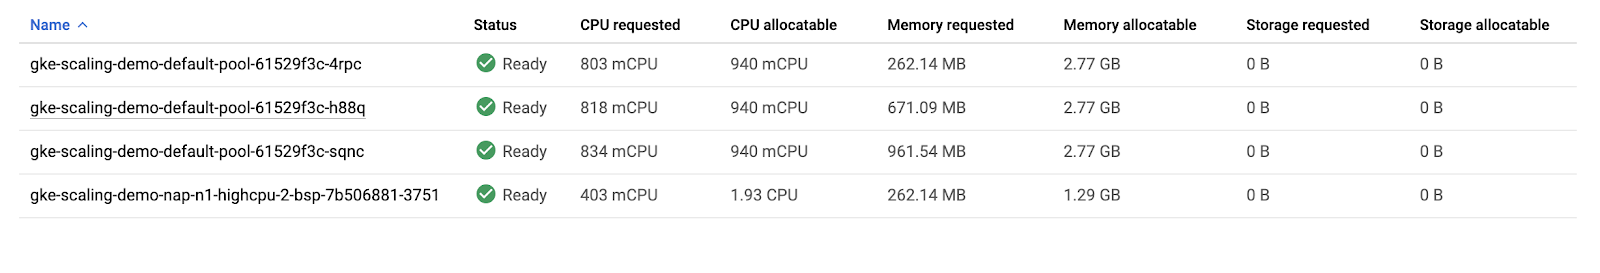
- Finally, node auto provisioning will create a node pool optimized for the CPU and memory requests of your cluster’s workloads. In this case, it should be a high cpu, low memory node pool because the load test is pushing the cpu limits.
Wait until your php-apache deployment is scaled up to 7 replicas and your nodes tab looks similar to this:
Return to the Cloud Shell tab you ran the load test in and cancel it by pressing Ctrl + c. Your cluster will now eventually scale back down as the demand decreases again.
Your cluster efficiently scaled up to meet a higher demand! However, take note of the amount of time it took to handle this spike in demand. For many applications, losing availability while provisioning new resources can be an issue.
Optimize larger loads
When scaling up for larger loads, horizontal pod autoscaling will add new pods while vertical pod autoscaling will resize them depending on your settings. If there’s room on an existing node, it might be able to skip pulling the image and immediately start running the application on a new pod. If you’re working with a node that hasn’t deployed your application before, a bit of time might be added if it needs to download the container images before running it.
So, if you don’t have enough room on your existing nodes and you’re using the cluster autoscaler, it could take even longer. Now it needs to provision a new node, set it up, then download the image and start up pods. If the node auto-provisioner is going to create a new node pool like it did in your cluster, there will be even more time as you provision the new node pool first, and then go through all the same steps for the new node.
In order to handle these different latencies for autoscaling, you’ll probably want to over-provision a little bit so there’s less pressure on your apps when autoscaling-up. This is really important for cost-optimization, because you don’t want to pay for more resources than you need, but you also don’t want your apps’ performance to suffer.
To figure out how much to overprovision, you can use this formula:
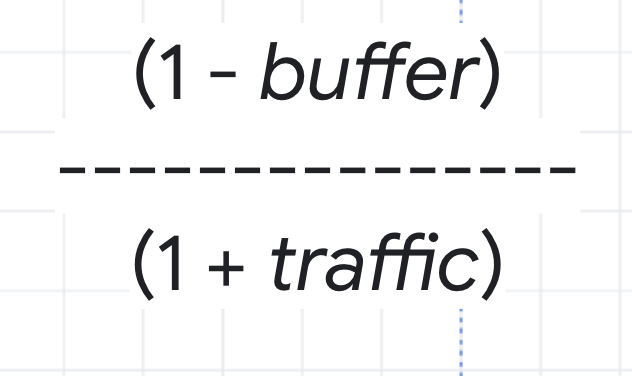
As an example, think about the CPU utilization for your cluster. You don’t want it to hit 100%, so you could choose a buffer of 15% to keep a safe distance. Then, the traffic variable in the formula would be the percentage of traffic growth estimated in the next 2 to 3 minutes. In the load test you ran earlier, 0% to 150% was a bit of an extreme growth example, so instead imagine a more average traffic growth of 30%.
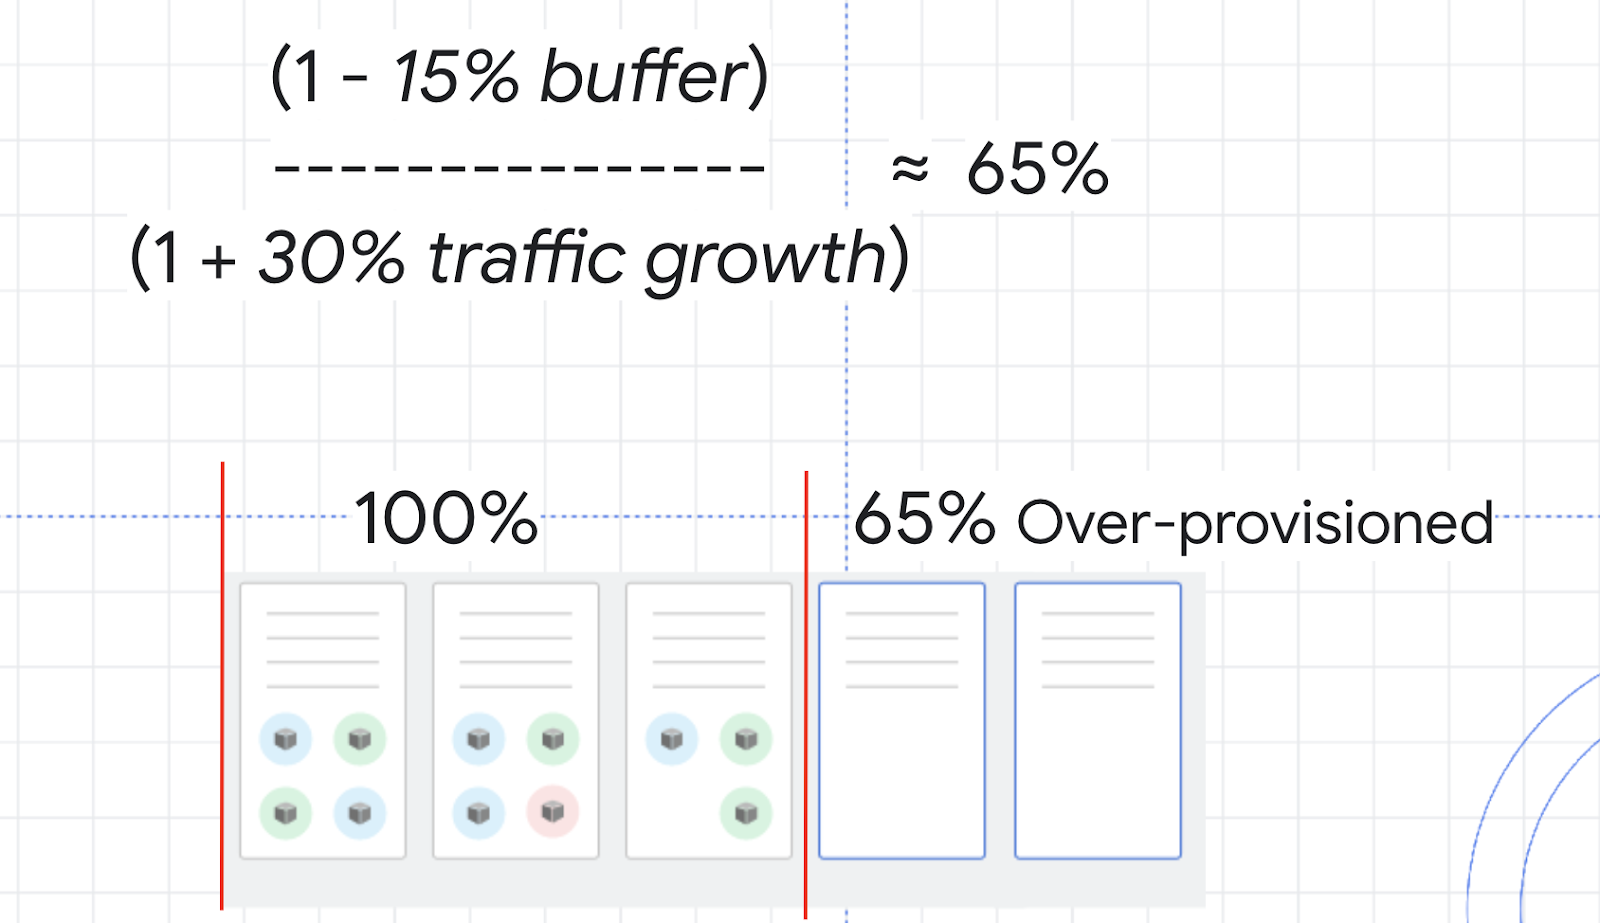
With these numbers, you can calculate a safety buffer of about 65%. That means you might want to over provision your resources by about 65% in order to handle scale ups while minimizing any issues.
An efficient strategy to overprovision a cluster with Cluster Autoscaling is to use Pause Pods.
Pause Pods are low priority deployments which are able to be removed and replaced by high priority deployments. This means you can create low priority pods which don’t actually do anything except reserve buffer space. When the higher-priority pod needs room, the pause pods will be removed and rescheduled to another node, or a new node, and the higher-priority pod has the room it needs to be scheduled quickly.
Create a manifest for a pause pod:
cat << EOF > pause-pod.yaml
---
apiVersion: scheduling.k8s.io/v1beta1
kind: PriorityClass
metadata:
  name: overprovisioning
value: -1
globalDefault: false
description: "Priority class used by overprovisioning."
---
apiVersion: apps/v1
kind: Deployment
metadata:
  name: overprovisioning
  namespace: kube-system
spec:
  replicas: 1
  selector:
    matchLabels:
      run: overprovisioning
  template:
    metadata:
      labels:
        run: overprovisioning
    spec:
      priorityClassName: overprovisioning
      containers:
      - name: reserve-resources
        image: k8s.gcr.io/pause
        resources:
          requests:
            cpu: 1
            memory: 4Gi
EOF
Apply it to your cluster:
kubectl apply -f pause-pod.yamlNow, wait a minute and then refresh the nodes tab of your scaling-demo cluster. If you’re no longer on this tab, you can return there with this link.
Observe how a new node is created, most likely in a new node pool, to fit your newly created pause pod. Now, if you were to run the load test again, when you needed an extra node for your php-apache deployment, it could be scheduled on the node with your pause pod while your pause pod is instead put on a new node. This is excellent because your dummy pause pods allow your cluster to provision a new node in advance so that your actual application can scale up much faster. If you were expecting higher amounts of traffic, you could add more pause pods, but it’s considered best practice to not add more than one pause pod per node.
Congratulations!
You configured a cluster to automatically and efficiently scale up or down based on its demand. Horizontal Pod Autoscaling and Vertical Pod Autoscaling provided solutions for automatically scaling your cluster’s deployments while Cluster Autoscaler and Node Auto Provisioning provided solutions for automatically scaling your cluster’s infrastructure.
As always, knowing which of these tools to use will depend on your workload. Careful use of these autoscalers can mean maximizing availability when you need it while only paying for what you need during times of low damand. When thinking about costs, this means you are optimizing your resource usage and saving money.
Get this hybrid and multi-cloud skill digital badge below by completing the remaining lab parts of this Google Qwiklabs Quest:
Google Cloud Training Quest: Optimize Costs for Google Kubernetes Engine